
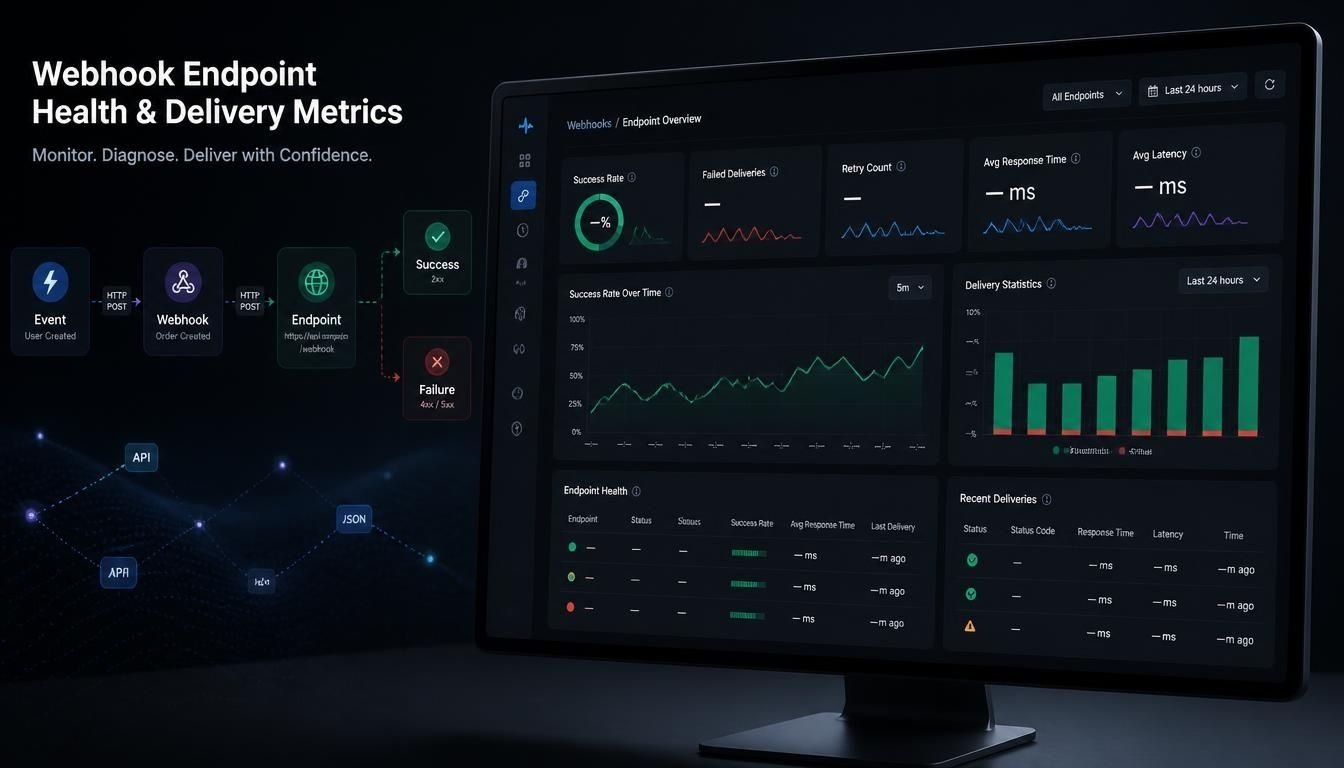
Webhook systems are only reliable when teams can clearly measure how well their endpoints receive and process events. Webhook endpoint health metrics success rate delivery statistics schema provides a structured way to track delivery performance, identify failures, and understand the health of webhook integrations.
A webhook may appear simple on the surface, but production systems need more than basic event delivery. Monitoring success rates, response times, retries, failed deliveries, and endpoint availability helps developers detect problems before they affect users or downstream services.
What Is a Webhook Delivery System?
A webhook delivery system sends an HTTP request to a configured endpoint whenever a specific event occurs. Instead of repeatedly requesting an API to check whether something changed, the receiving application gets the information automatically.
For example, a payment platform may send a webhook when a payment succeeds. The receiving application can then update an order, send a confirmation email, or trigger another workflow.
A typical webhook delivery flow looks like this:
Event occurs → Webhook created → Delivery attempted → Endpoint responds → Result recorded
If the endpoint fails to respond correctly, the delivery system may retry the request based on its configured retry policy.
Why Webhook Endpoint Health Matters
A webhook endpoint can become unreliable for several reasons, including server downtime, network problems, application errors, timeouts, or incorrect configuration.
This is why webhook endpoint health metrics success rate delivery statistics schema should include measurable indicators rather than simply showing whether a webhook is enabled.
Useful health indicators include:
- Successful deliveries
- Failed deliveries
- HTTP response codes
- Response time
- Timeout rate
- Retry count
- Delivery latency
- Endpoint availability
- Events delivered per period
- Permanently failed events
These metrics help teams understand whether their webhook infrastructure is operating normally.
Key Webhook Health Metrics to Track
1. Delivery Success Rate
Success rate shows the percentage of webhook delivery attempts that receive an acceptable response.
A basic formula is:
Success Rate = Successful Deliveries ÷ Total Delivery Attempts × 100
For example, if 9,800 out of 10,000 delivery attempts succeed, the success rate is 98%.
Tracking this percentage over time makes it easier to identify gradual reliability problems.
2. Delivery Failure Rate
Failure rate is the percentage of attempts that do not receive a successful response.
Common causes include:
- HTTP 4xx errors
- HTTP 5xx errors
- Connection failures
- DNS problems
- Timeouts
- Invalid endpoint configurations
A sudden increase in failures can indicate that the receiving application or webhook infrastructure needs attention.
3. Response Time
Response time measures how quickly an endpoint responds after receiving a webhook request.
Average response time can be useful, but percentiles such as p95 and p99 often provide better insight into occasional slow requests.
For example:
- Average: 180 ms
- p95: 450 ms
- p99: 1,200 ms
The average looks healthy, but the p99 value shows that some requests are taking considerably longer.
4. Retry Rate
Webhook systems commonly retry failed deliveries.
A high retry rate can indicate:
- Temporary endpoint failures
- Server overload
- Slow processing
- Network instability
- Incorrect response handling
Monitoring retries can help identify problems before they become permanent delivery failures.
5. Delivery Latency
Delivery latency measures the time between an event being generated and the receiving endpoint successfully processing the webhook.
Low latency is particularly important for systems involving payments, notifications, inventory updates, and real-time workflows.
Building a Webhook Delivery Statistics Schema
A useful webhook endpoint health metrics success rate delivery statistics schema should store enough information to understand individual delivery attempts as well as overall endpoint performance.
A basic statistics structure could contain:
| Field | Purpose |
|---|---|
| endpoint_id | Identifies the webhook endpoint |
| event_type | Identifies the event being delivered |
| delivery_id | Unique delivery identifier |
| status | Delivery result |
| http_status | HTTP response code |
| response_time_ms | Endpoint response time |
| attempt_number | Number of delivery attempts |
| created_at | Event creation timestamp |
| delivered_at | Successful delivery timestamp |
| error_type | Reason for failure |
| retry_count | Number of retries |
This information can support dashboards, alerts, debugging tools, and historical reports.
Example Webhook Health Metrics Schema
A simple JSON-style structure can look like this:
{
  "endpoint_id": "endpoint_123",
  "period": "2026-08-20T00:00:00Z",
  "total_deliveries": 10000,
  "successful_deliveries": 9800,
  "failed_deliveries": 200,
  "success_rate": 98.0,
  "average_response_time_ms": 180,
  "p95_response_time_ms": 450,
  "retry_count": 320,
  "timeout_count": 45
}
The exact schema will depend on the application and monitoring requirements, but the goal is the same: turn webhook activity into measurable operational data.
How to Monitor Webhook Endpoint Health
Effective monitoring should combine real-time alerts with historical statistics.
For example, a monitoring dashboard might display:
- Current success rate
- Requests received
- Failed deliveries
- Average response time
- p95 response time
- Retry volume
- Timeout percentage
- Recent failed events
Teams can then establish thresholds.
For example, an alert could trigger when the webhook success rate drops below 95% for a defined period.
This is more useful than sending an alert for every individual failed request because temporary failures do not always indicate a serious incident.
Webhook Delivery Statistics and Historical Trends
Real-time monitoring tells you what is happening now. Historical statistics help explain what happened over time.
A useful dashboard can compare:
Today vs. yesterday
This week vs. last week
Current success rate vs. historical average
This can reveal recurring problems such as endpoint failures during high traffic periods.
Historical data can also help developers evaluate whether infrastructure changes improved webhook reliability.
What Are the Different Types of Webhooks?
Webhooks can be categorized in different ways depending on how they are implemented.
Common examples include:
Event-Based Webhooks
These are triggered when a specific event occurs, such as a new customer registration or successful payment.
Outgoing Webhooks
An application sends event information to another system through an HTTP request.
Incoming Webhooks
An application exposes an endpoint that accepts requests from an external service.
Batch Webhooks
Multiple events may be grouped together and delivered in a single request, depending on the provider.
The implementation details vary between platforms, so monitoring should reflect the specific webhook architecture being used.
What Is a Webhook Used For?
Webhooks are commonly used to connect applications and automate workflows.
Examples include:
- Payment notifications
- Order updates
- User registration events
- CRM synchronization
- Messaging notifications
- Inventory changes
- Git repository events
- Subscription updates
- Security alerts
Instead of continuously polling an API, the receiving system can react when an event occurs.
Popular Webhook Providers
Many API and software platforms provide webhook functionality as part of their services.
Examples include payment platforms, communication services, developer tools, SaaS applications, and automation platforms.
When evaluating a provider, developers should consider more than whether it supports webhooks. Important factors include retry behavior, delivery logs, observability, security features, event ordering, documentation, and monitoring capabilities.
Webhook Security Considerations
Monitoring webhook health is only one part of operating a reliable webhook system. Security also needs to be considered.
Common security practices include:
- HTTPS endpoints
- Request signature verification
- Secret tokens
- Timestamp validation
- Replay protection
- Request authentication
- IP restrictions where appropriate
- Idempotent event processing
A webhook endpoint should also avoid exposing sensitive information through logs or error messages.
Improving Webhook Reliability
Developers can improve reliability by designing both the sender and receiver to handle failures gracefully.
Useful practices include:
- Return appropriate HTTP status codes.
- Process events asynchronously when possible.
- Implement idempotency.
- Use controlled retries.
- Track failed deliveries.
- Monitor response times.
- Store delivery IDs.
- Provide replay or redelivery functionality.
- Alert on unusual failure patterns.
- Keep detailed but secure delivery logs.
These practices make it easier to recover from temporary failures without losing important events.
Final Thoughts
A reliable webhook system requires visibility into more than whether an endpoint is online. Webhook endpoint health metrics success rate delivery statistics schema can help teams organize the data needed to measure delivery reliability, investigate failures, and improve system performance.
By tracking success rates, response times, retries, latency, HTTP errors, and endpoint availability, developers can identify problems earlier and build more dependable integrations. A well-designed statistics schema also makes it easier to create dashboards and automated alerts as webhook traffic grows.
Frequently Asked Questions
What is a webhook delivery system?
A webhook delivery system sends event information from one application to another through an HTTP request when a defined event occurs.
What metrics should be monitored for webhook endpoints?
Important metrics include delivery success rate, failure rate, response time, latency, retry rate, timeout rate, HTTP status codes, and endpoint availability.
How do you calculate webhook success rate?
Webhook success rate can be calculated by dividing successful delivery attempts by total delivery attempts and multiplying the result by 100.
Why are webhook delivery statistics important?
Delivery statistics help developers identify failed requests, slow endpoints, recurring errors, and reliability problems across webhook integrations.
What should a webhook health metrics schema contain?
A useful webhook endpoint health metrics success rate delivery statistics schema can include endpoint ID, event type, delivery ID, status, HTTP status, response time, attempt number, timestamps, error type, and retry count.
How can webhook failures be handled?
Webhook failures can be handled through retries, timeout controls, error logging, monitoring, alerting, and replay mechanisms. The receiving application should also process duplicate events safely.
What is webhook system design?
Webhook system design covers how events are generated, queued, delivered, retried, authenticated, monitored, and processed by receiving endpoints.
Why should webhook response time be monitored?
Slow responses can increase delivery latency, cause timeouts, and trigger unnecessary retries. Monitoring response-time percentiles can help identify performance problems.
Should webhook systems support retries?
Yes. Controlled retries can help recover from temporary network or server failures. Retry policies should include sensible limits and backoff to prevent excessive traffic.